So you’ve spent a good bit of time and money creating your website. You’re pretty pleased with yourself and hoping that now that you built it, leads will come.
Well, there are a number of factors including SEO that dramatically impact the quality and quantity of your leads, but that’s a topic for another time. Today’s article assumes you have done your SEO homework and the leads are in fact coming in, but now you want to know what they’re doing once they get there. Too bad you can’t be a fly on the wall to watch what actions they take — where they scroll, where they click and where they move.
Guess what? You can!
Whether you’re A/B testing your website design or figuring out the best place to put a call-to-action on your blog posts, heat maps are your best tool for measuring attention and designing content that connects with your audience and converts them into leads and customers.
What is a heatmap?
For those familiar with the electrical contracting industry, you’re likely aware of how thermographic inspections of electrical equipment detect hot-spots. Infrared scanning is essential because it finds problems that normally would be missed, possibly causing an outage. Well, a heat map on your website works in a similar way.
A heat map is a visual representation of the engagement a page on your website receives. It uses a color spectrum to determine which sections of your page are better at holding attention. The “hot” sections attract the most amount of attention, and the “cold” sections attract the least amount of attention.
Heatmaps help you understand what users want, care about, and do on your website or app by visually representing their clicks, taps, and scrolling behavior.
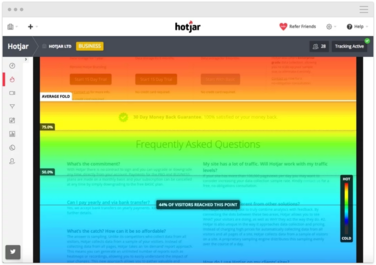
Scroll Heatmaps
Scroll Heatmaps are used to show you how far down your visitors scroll.
You might have a lot to say on your website — because let’s face it, we all try to tell everyone everything about why they should buy from us — but how much do they really care? Do they care enough to scroll down through your entire web page to absorb all of your content? Probably not. But how far are they scrolling? You’re trying to get leads but are users even reaching the lead form?
Using a heatmap tool like Hotjar tracks how far each of your visitors in your Heatmap report scrolled down while browsing your page. This data is presented by analyzing the amount of visitors to the page versus the depth each visitor scrolled to on your page. This results in an average of how many users scrolled to each portion of your page. To see this, you can place your mouse over the Scroll Heatmap where a marker will show, indicating the exact percentage of visitors that reached that point of your page.
Click & Tap Heatmaps
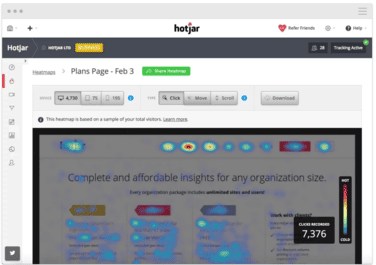
Click or Tap Heatmaps will help you determine where your visitors are clicking. Tapping will be tracked if they are on a mobile/tablet.
One of the analytics that most website gurus will tell you is that time on your site is important. Well, the best way to keep users engaged with your site is to create good content that is audience-appropriate, intuitive navigation, and internal links to keep them engaged within your site.
Click and tap heatmaps help you quickly uncover issues with your page – for example, are visitors clicking your links? Or are they clicking areas that aren’t links? Heatmap tools tracks the clicks and taps of all visitors included in your heatmap report and automatically generates a visual representation of the areas your visitors clicked on.
Move Heatmaps
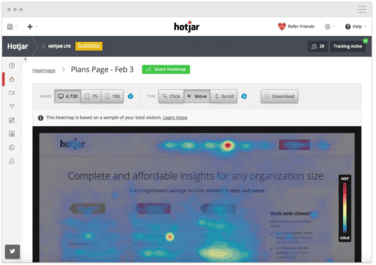
Move Heatmaps show where visitors have moved their mouse on the screen.
Some people read while moving their cursor. Others use their cursor as they scroll and move over a site, even if they don’t click. This can provide worthwhile insight into your website user behavior, as well as how your content is resonating with audiences. Hotjar, for example, samples the mouse movement of all visitors included in your Heatmap report and automatically generates a visual representation of the areas your visitors moved their mouse over.
Analyzing the heat map of each type of page on your website would be ideal, but, unfortunately, it isn’t efficient. The most effective way to leverage heat maps is to analyze the pages that influence your website’s conversion rate the most: your home page, landing pages, and high-conversion blog posts.
Need help learning more about your website and your visitors? Email us at [email protected] or 410-366-9479, and we’ll help you heat up your marketing with a heatmap!
Incite Creative is a marketing strategy and creative implementation firm that works in an outsourced capacity. In short, we become your company’s chief marketing officer (CMO) and do so virtually and efficiently — saving you time and money. Since 1999 we’ve had the pleasure of building and boosting brands for a core set of industries. Our thoughtful process, experienced team, and vested interest in our client’s success has positioned us as one of the Mid-Atlantic’s most sought-after marketing partners for those looking to grow their brand awareness and their bottom line. Stop paying for digital and/or traditional services you may not really need. Our retainer, no mark-up model means our recommendations don’t come with any catch or commission. The recommendations we make align with what you need and what fits within your budget. For more information, contact Dina Wasmer at 410-366-9479 or [email protected].